Showing posts with label matplotlib. Show all posts

How to draw a simple line using python and the matplotlib API -


This is my OLD blog. I've copied this post over to my NEW blog at:

http://www.saltycrane.com/blog/2007/01/how-to-draw-simple-line-using-python_05/

You should be redirected in 2 seconds.


I'm continuing to learn the low level object oriented matplotlib API. My goal is to create very customizable, perfect plots. Here is how to draw a simple line. First create a figure that is 4 inches by 4 inches. Then create some axes with a 10% margin around each edge. Then add the axes to the figure. Then create a line from (0,0) to (1,1). Then add the line to the axes. Then create a canvase. Then create the .png file. Looks like good object oriented python fun to me...


""" line_ex.py                                             
"""
from matplotlib.figure import Figure
from matplotlib.axes import Axes
from matplotlib.lines import Line2D
from matplotlib.backends.backend_agg import FigureCanvasAgg

fig = Figure(figsize=[4,4])
ax = Axes(fig, [.1,.1,.8,.8])
fig.add_axes(ax)
l = Line2D([0,1],[0,1])
ax.add_line(l)

canvas = FigureCanvasAgg(fig)
canvas.print_figure("line_ex.png")

[Read the full post...]

How to use the pylab API vs. the matplotlib API


This is my OLD blog. I've copied this post over to my NEW blog at:

http://www.saltycrane.com/blog/2007/01/how-to-use-pylab-api-vs-matplotlib-api_3134/

You should be redirected in 2 seconds.


This article has a good description of the 2 API's in matplotlib: the pylab API and the matplotlib API. I've been using the pylab interface because it is easier, especially coming from a matlab background. But I wanted to get direct access to the matplotlib classes so I needed to use the matplotlib API. Here is a simple example that creates a .png figure using the 2 different API's.

Here is the example using the pylab API:
""" api_pylab.py          
"""
from pylab import *

figure(figsize=[4,4])
axes([.1,.1,.8,.8])
scatter([1,2],[3,4])
savefig('api_pylab.png')

Here is the example using the matplotlib API:
""" api_matplotlib.py                                        
"""
from matplotlib.figure import Figure
from matplotlib.backends.backend_agg import FigureCanvasAgg

fig = Figure(figsize=[4,4])
ax = fig.add_axes([.1,.1,.8,.8])
ax.scatter([1,2], [3,4])
canvas = FigureCanvasAgg(fig)
canvas.print_figure("api_matplotlib.png")

[Read the full post...]

How to create some derived arrow classes with matplotlib and python


This is my OLD blog. I've copied this post over to my NEW blog at:

http://www.saltycrane.com/blog/2007/01/how-to-create-some-derived-arrow_03/

You should be redirected in 2 seconds.


Here is an example of how to create some derived arrow classes with matplotlib and python. The arrow() function in matplotlib accepts origin and delta x and delta y inputs. I changed this to polor coordinates so Arrow2 accepts the x and y coordinates of the origin, the length, and the angle. Then I created 4 classes derived from Arrow2 called ArrowRight, ArrowLeft, ArrowUp, and ArrowDown. These just set the angle for you to 0, 180, 90, and 270 respectively. Notice too that the **kwargs can be passed down so you can still set all the other parameters.
""" arrow_ex2.py """ 
from pylab import *  

def main(): 
    figure() 
    axes() 
    Arrow2(.5,.5,.2,45) 
    ArrowRight(.5,.5,.2) 
    ArrowLeft(.5,.5,.2) 
    ArrowUp(.5,.5,.2) 
    ArrowDown(.5,.5,.2) 
    show() 

class Arrow2: 
    def __init__(self, x0, y0, length, angle=0.0, color='k', width=0.01, **kwargs):          
        dx = length*cos(angle*pi/180) 
        dy = length*sin(angle*pi/180) 
        arrow (x0, y0, dx, dy, 
               width=width, 
               edgecolor=color,  
               facecolor=color,  
               antialiased=True,  
               head_width=5*width, 
               head_length=7.5*width, 
               **kwargs)

class ArrowRight(Arrow2): 
    def __init__(self, x0, y0, length, **kwargs): 
        Arrow2.__init__(self, x0, y0, length, angle=0.0, **kwargs)

class ArrowLeft(Arrow2): 
    def __init__(self, x0, y0, length, **kwargs): 
        Arrow2.__init__(self, x0, y0, length, angle=180.0, **kwargs)                      

class ArrowUp(Arrow2): 
    def __init__(self, x0, y0, length, **kwargs): 
        Arrow2.__init__(self, x0, y0, length, angle=90.0, **kwargs) 

class ArrowDown(Arrow2): 
    def __init__(self, x0, y0, length, **kwargs): 
        Arrow2.__init__(self, x0, y0, length, angle=270.0, **kwargs) 

if __name__ == "__main__": 
    main() 

[Read the full post...]

How to draw an arrow with matplotlib and python


This is my OLD blog. I've copied this post over to my NEW blog at:

http://www.saltycrane.com/blog/2007/01/how-to-draw-arrow-with-matplotlib-and/

You should be redirected in 2 seconds.


Here is an example of how to draw an arrow with matplotlib. It should be
very easy, but I had to change the width setting so the arrow head would
not be too small. Further documentation is here:
http://matplotlib.sourceforge.net/matplotlib.pylab.html#-arrow

""" arrow_ex.py
"""
from pylab import *
figure()
axes()
arrow(.1,.1,.2,.2, width=0.01)
show()
[Read the full post...]

Example pie charts using python and matplotlib


This is my OLD blog. I've copied this post over to my NEW blog at:

http://www.saltycrane.com/blog/2006/12/example-pie-charts-using-python-and/

You should be redirected in 2 seconds.
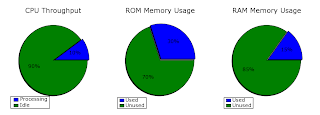


I needed to make some pie charts and didn't like the results I got from Excel. It was too hard to customize the plots exactly the way I wanted them. I have used Matlab before and I preferred Matlab to Excel. However, Python is my favorite thing to use so I searched for python and matlab on Google and found matplotlib. Matplotlib is a matlab-like plotting library for Python. You can get matplotlib from http://matplotlib.sourceforge.net/, but it is also bundled with the Enthought version of Python so I got it from there. Update: I realized that the Enthought bundle didn't include the latest version of matplotlib so I installed the latest version of matplotlib and the required NumPy as well.

Step-by-step:
1. Download enthought version of Python 2.4.3 from http://code.enthought.com/enthon/ (Click on the "enthon-python2.4-1.0.0.exe" link is at the bottom of the page) and install it.
2. Download "numpy-1.0.1.win32-py2.4.exe" from http://sourceforge.net/project/showfiles.php?group_id=1369 and install it.
3. Download "matplotlib-0.87.7.win32-py2.4.exe" from http://sourceforge.net/projects/matplotlib and install it.
3. Open a text editor and type this inside:
#!/usr/bin/env python
"""
http://matplotlib.sf.net/matplotlib.pylab.html#-pie for the docstring.
"""
from pylab import *

# create figure
figwidth = 10.0    # inches
figheight = 3.5   # inches
figure(1, figsize=(figwidth, figheight))
rcParams['font.size'] = 12.0
rcParams['axes.titlesize'] = 16.0
rcParams['xtick.labelsize'] = 12.0
rcParams['legend.fontsize'] = 12.0
explode=(0.05, 0.0)
colors=('b','g')
Ncols = 3
plotheight = figwidth/Ncols
H = plotheight/figheight
W = 1.0 / Ncols
margin = 0.1
left = [W*margin, W*(1+margin), W*(2+margin)]
bottom = H*margin
width = W*(1-2*margin)
height = H*(1-2*margin)

# cpu utilization
utilized = 10.0
free = 100.0 - utilized
fracs = [utilized, free]
axes([left[0], bottom, width, height])
patches = pie(fracs, colors=colors, explode=explode, autopct='%1.f%%', shadow=True)
title('CPU Throughput')
legend((patches[0], patches[2]), ('Processing', 'Idle'), loc=(0,-.05))

# ROM utilization
utilized = 30.0
free = 100.0 - utilized
fracs = [utilized, free]
axes([left[1], bottom, width, height])
patches = pie(fracs, colors=colors, explode=explode, autopct='%1.f%%', shadow=True)
title('ROM Memory Usage')
legend((patches[0], patches[2]), ('Used', 'Unused'), loc=(0,-.05))

# RAM utilization
utilized = 15.0
free = 100.0 - utilized
fracs = [utilized, free]
axes([left[2], bottom, width, height])
patches = pie(fracs, colors=colors, explode=explode, autopct='%1.f%%', shadow=True)
title('RAM Memory Usage')
legend((patches[0], patches[2]), ('Used', 'Unused'), loc=(0,-.05))

savefig('utilization')
show()
4. Save the file as piechart.py in c:\temp
5. In Windows, go to Start -> All Programs -> Python 2.4 (Enthought Edition) -> IPython Shell
6. Type in "cd c:\temp"
7. Type "run piechart.py" and hit enter
Technorati tags: , ,
[Read the full post...]

About

This is my *OLD* blog. I've copied all of my posts and comments over to my NEW blog at:

http://www.saltycrane.com/blog/.

Please go there for my updated posts. I will leave this blog up for a short time, but eventually plan to delete it. Thanks for reading.